October 10, 2022
Welcome
Overview
Rbanism
- Organised as part of Rbanism, a Netherlands eScience Center fellowship project.
- Rbanism aims to build capacity, competence, and confidence for working with data and research software in the urbanism research community at large.
- This workshop is the first of an event series focusing on reproducibility, automation and scalability in urbanism research.
- Promote the practice of reproducibility and automation necessary for accelerating scientific progress in urbanism and associated fields.
Workshop schedule
- Introduction (9:30)
- Organisation
- Coffee break
- Automation I
- Lunch break (12:30-13:30)
- Automation II
- Literate programming I
- Coffee break
- Literate programming II
- Publishing
- Wrap-up & drinks (16:30)
Introduction
- Getting to know you
- Recognize the problems that reproducible research helps address
- Introduce tools that address your pain points in making your research reproducible
- Demo: Computational toolkit for reproducible data analysis
Getting to know you…

…with respect to reproducibility

…with respect to reproducibility

…with respect to reproducibility

Why should we care about reproducibility?
Motivating reproducibility
“Computational notebooks […] open up the world of analytics to […] disciplines that encompass diverse methodologies and skillsets [such as] urban planning […] Some urban planners focus on policymaking […] Others employ qualitative methods to work in and with vulnerable communities. Others develop simulation models to forecast urbanization patterns and infrastructure needs. Others intermingle these, and many more, different approaches to understanding and shaping the city. Yet all urban planners benefit [or should!] from basic quantitative literacy and an ability to reason critically with data. This scholarly and professional imperative aligns with the growing importance of computational thinking in the urban context and parallel trends in geocomputation […], geographic data science […], and the open-source/open-science movements […].” (Boeing, 2019, p. 40)
Motivating reproducibility
“toolkits relying on point-and-click interfaces are inefficient in the era of big data. Due to the limited scope for automation of tasks, not only is workflow efficiency reduced but also the reproducibility of the underlying research is compromised, because this largely depends on the (often undocumented) sequence of decisions manually operating the software. […] We then argue that the field [of urban morphology] needs a shift from dominant traditional geographic information system (GIS) environments based on a graphical user interface (GUI; e.g., QGIS or ArcMap) towards reproducible open code-based workflows.” (Fleischmann et al., 2022, p. 3)
Motivating reproducibility
- Even qualitative work like literature reviews can be done in a systematic, reproducible and automated way (e.g., see Krishnan et al., 2021)
- A reproducible workflow allows for close scrutiny and interaction with the data and results of a publication, potentially leading to new insights as well (e.g., see Cottineau, 2022)
- Reproducibility can contribute to increasing the scientific legitimacy of design-focused urbanism research often regarded as pseudoscientific (see Marshall, 2012)
However, these are potentials yet to meet
- Everyone (urbanists and non-urbanists) struggles with reproducibility and it is a hindrance to moving science forward
- Even with a fairly simple analysis challenges are usually faced in four main areas: organization, automation, documentation, and dissemination
Four facets of reproducibility
Organization: tools to organize your projects so that you don’t have a single folder with hundreds of files
Automation: the power of scripting to create automated data analyses
Documentation: difference between binary files (e.g. docx) and text files and why text files are preferred for documentation
Dissemination: publishing is not the end of your analysis, rather it is a way station towards your future research and the future research of others
Reproduciblility toolkit
R + RStudio


Why R?
- Made for data analysis
- Free!
- Open source
- Widely used across disciplines
- Runs on Windows, OS X, or Linux

Once in R
You could just type into the console…
… but that doesn’t help much with documentation
… but that doesn’t help much with automation
A better solution
With RStudio you can combine your programming and your documentation
- RStudio gives you a single environment to combine your documentation and your analysis
- It runs on top of R
- Gives you a bunch of really cool features some of which we’ll explore throughout the workshop
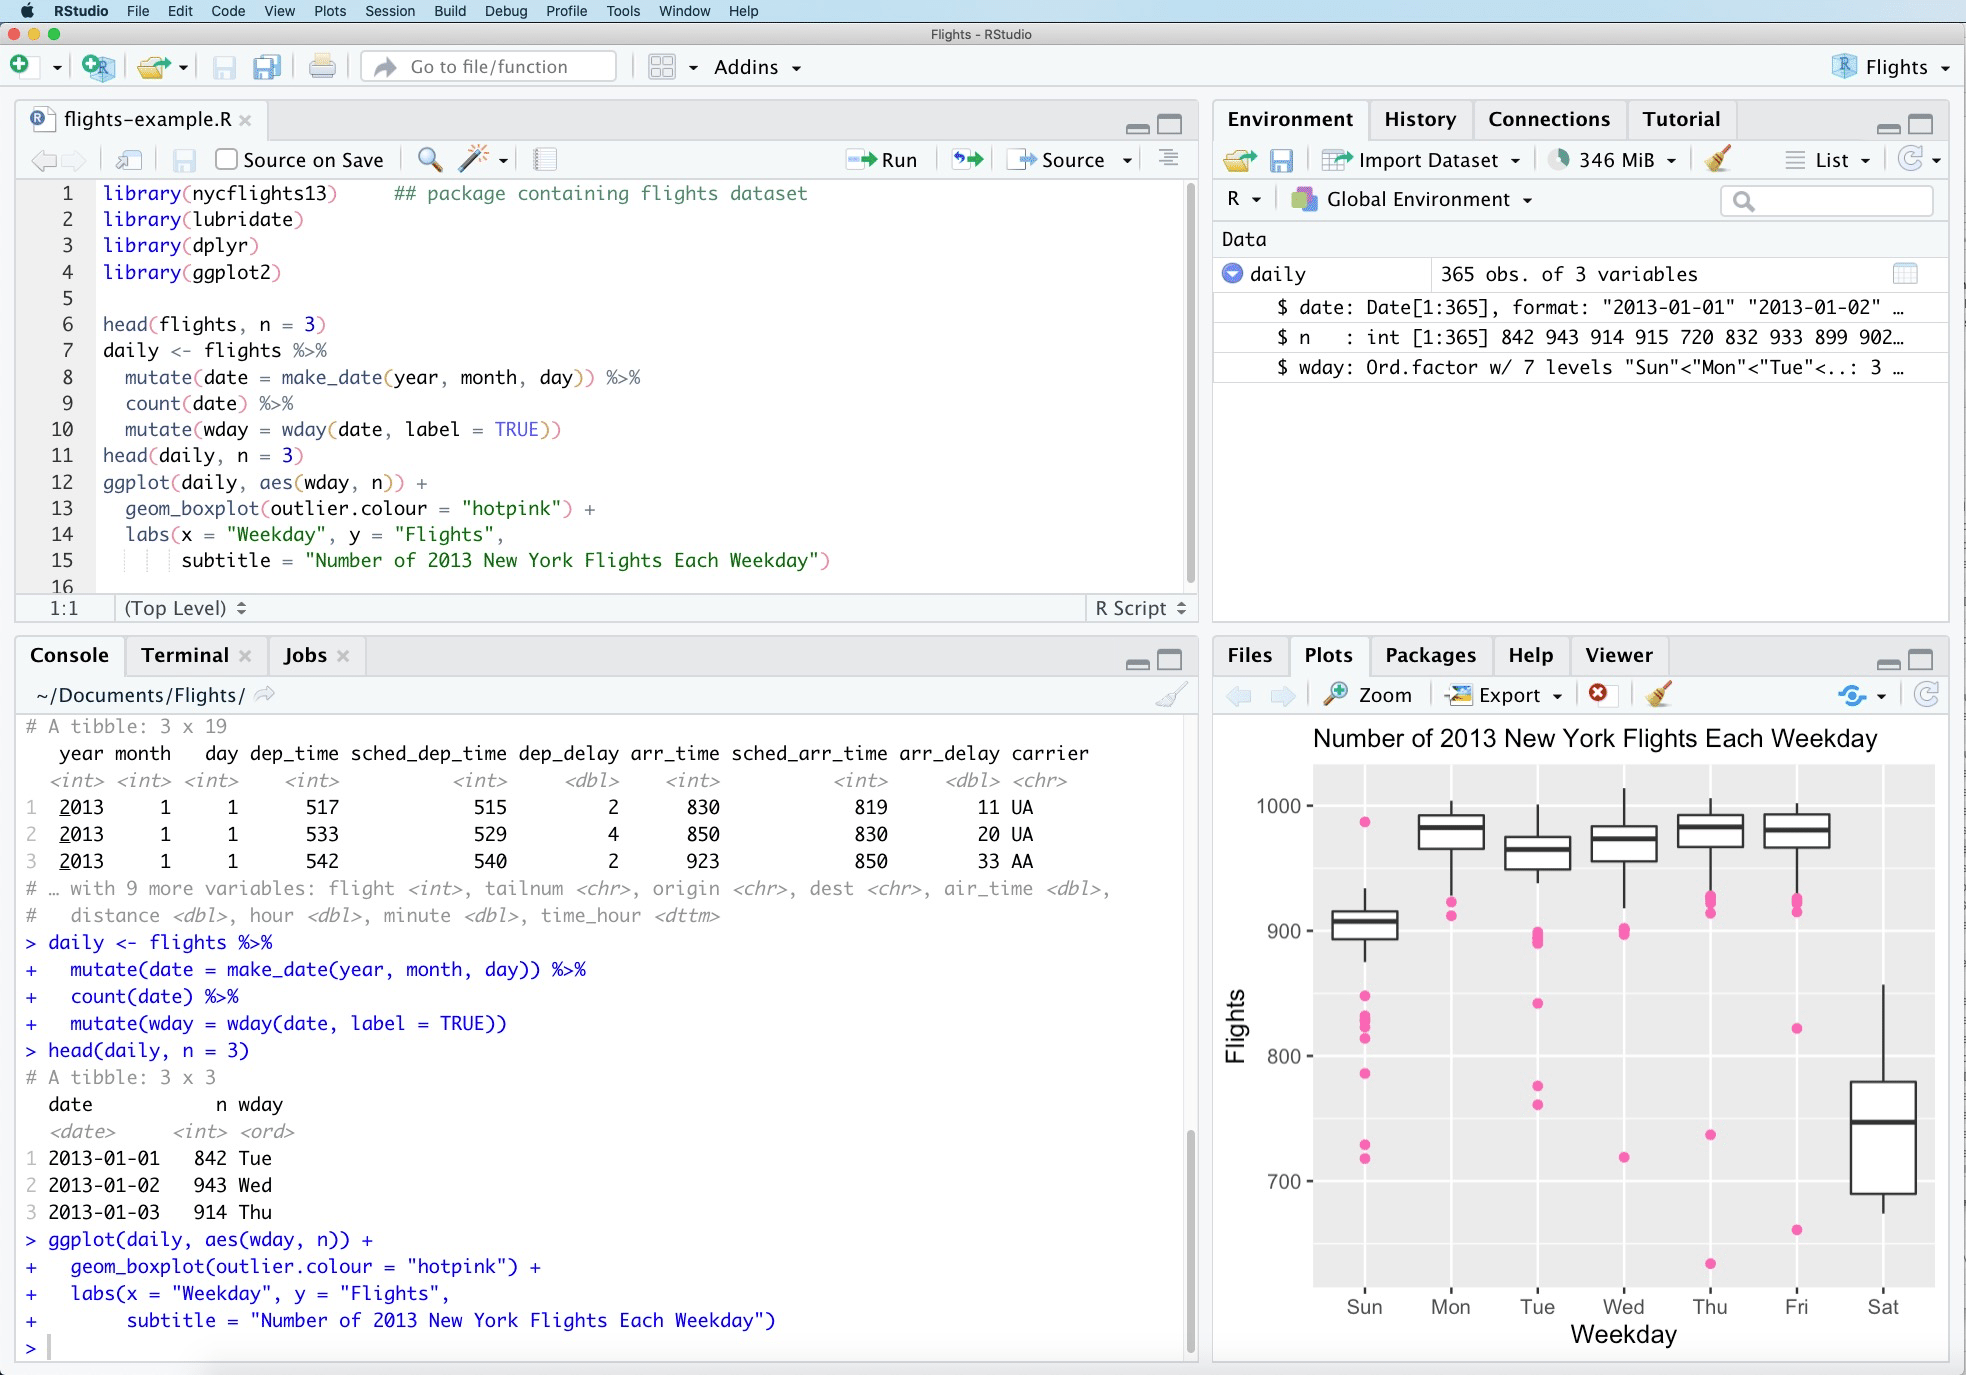
Anatomy of RStudio
- Upper left: Editor
- Lower left: Console
- Text on top at launch: version of R that you’re running
- Below that is the prompt
- Upper right: Workspace and command history
- Lower right: Plots, access to files, help, packages, data viewer
R Packages
Packages are the fundamental units of reproducible R code. They include reusable R functions, the documentation that describes how to use them, and (often) sample data. (From: http://r-pkgs.had.co.nz)
We will use the
ggplot2package for plots anddplyrfor data wrangling in this session.If you have not yet done so, install these packages by running the following in the Console:
install.packages("ggplot2")
install.packages("dplyr")
- This is just one way of installing a package, there is also a GUI approach in the Packages pane
Demo
Goals of the demo
- Demonstrate “good practice” for organizing data files and analysis documents (R Markdown)
- How to read data from a file
- How to manipulate the data, and document it in a reproducible way
- How easy it would be to revert any changes if need be
- How to subset data
- How to make simple plots
NOT about understanding all the R commands, but rather getting the big picture of how using R in this way facilitates reproducible analyses
Preparation
Download the archive you received by email with the files we will use in the workshop.
Follow the instructions in the email to unzip the archive into a folder that you will use as your project folder.
Put a green sticky note on the front of your laptop if you are ready or a pink one if you need help and a helper will approach you.
R Markdown demo
Go to your project folder and double click on
documents/intro-demo.Rmdand it should open in RStudioClick on Knit HTML to compile the document
Read the output and discuss why this way of documenting research is reproducible
Take aways
- The analysis is self-documenting
- It’s easy to extend or refine analyses by copying and modifying code blocks
- The results of the analysis can be disseminated by sending R Markdown and providing data sources, or just simply providing the generated HTML if just a summary of the analysis is needed
Reproducibility checklist
Reproducibility checklist
Checklist available in documents/checklist.md
- Serves as a tool to help you think about the reproducibility of your data analysis.
- Many of the questions can be thought of as having a yes/no answer.
- A better approach would be to see the questions as being open ended with the real question being, “What can I do to improve the status of my project on this bullet point?”
- With that in mind, you’ll never get 100% of the bullets right for your project, but you’ll always be improving.